
Key Takeaways
- Kubernetes cost optimization means matching cluster capacity to real workload demand through visibility, rightsizing, autoscaling, purchasing strategy, and selective automation, without hurting reliability.
- Average CPU utilization across production Kubernetes clusters is only 8 percent in 2026, which means most organizations pay for capacity that sits idle and never does any work.
- Padded resource requests, conservative Helm defaults, and autoscalers that scale based on requests rather than actual usage create a compounding feedback loop of waste.
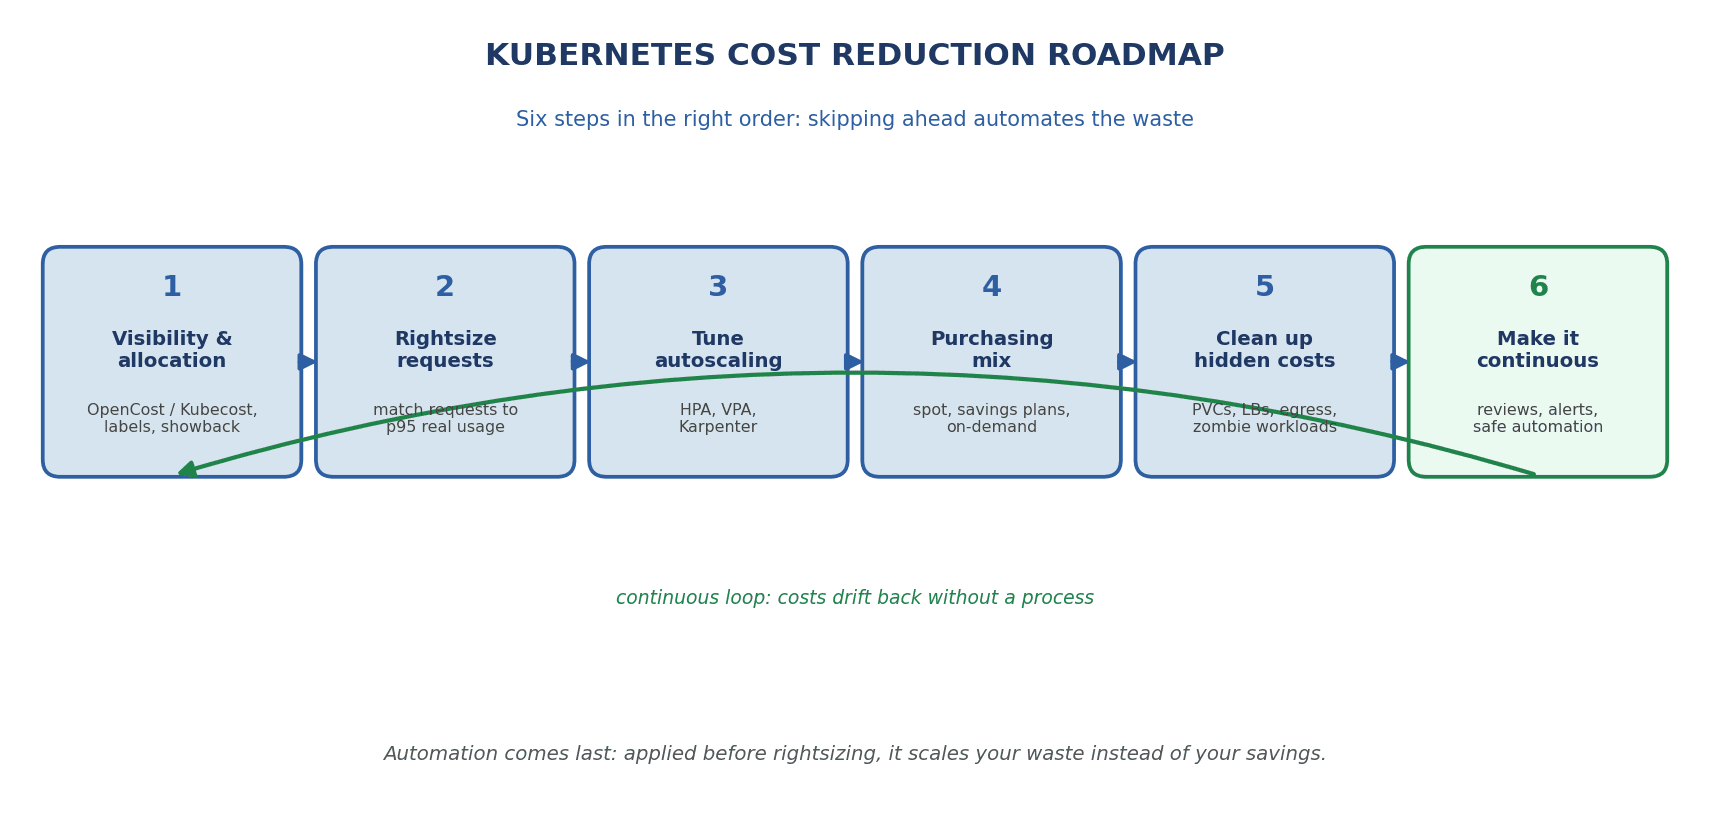
- A six step Kubernetes cost reduction roadmap works best in sequence: visibility, rightsizing, autoscaling, purchasing, cleanup, then continuous improvement. Skipping ahead usually multiplies waste.
- Automation and k8s cost optimization tools deliver real savings, but they must be deployed gradually with clear guardrails to avoid reliability regressions like OOM kills or throttling.
Introduction: What Kubernetes Cost Optimization Really Means in 2026
Kubernetes cost optimization is the practice of matching cluster resources to actual workload demand through visibility, rightsizing, autoscaling, smarter purchasing, and automation, without degrading reliability or application performance. It reduces operational expenses for workloads by eliminating idle resources, overprovisioned capacity, and inefficient pricing.
Here is the problem: according to the Cast AI 2026 State of Kubernetes Optimization Report, average CPU utilization across tens of thousands of production Kubernetes clusters is just 8 percent. That means most companies pay for capacity that remains idle, and this waste shows up directly on every cloud bill.
This guide covers why Kubernetes costs balloon, the critical difference between Kubernetes cost management and optimization, a sequenced six step reduction roadmap, a vendor-neutral tools overview, and an honest look at what to automate safely. AppRecode audits and optimizes client clusters across AWS, Azure, and GCP, and this guide reflects what actually works in production, not tool marketing.
Why Kubernetes Costs Get Out of Control
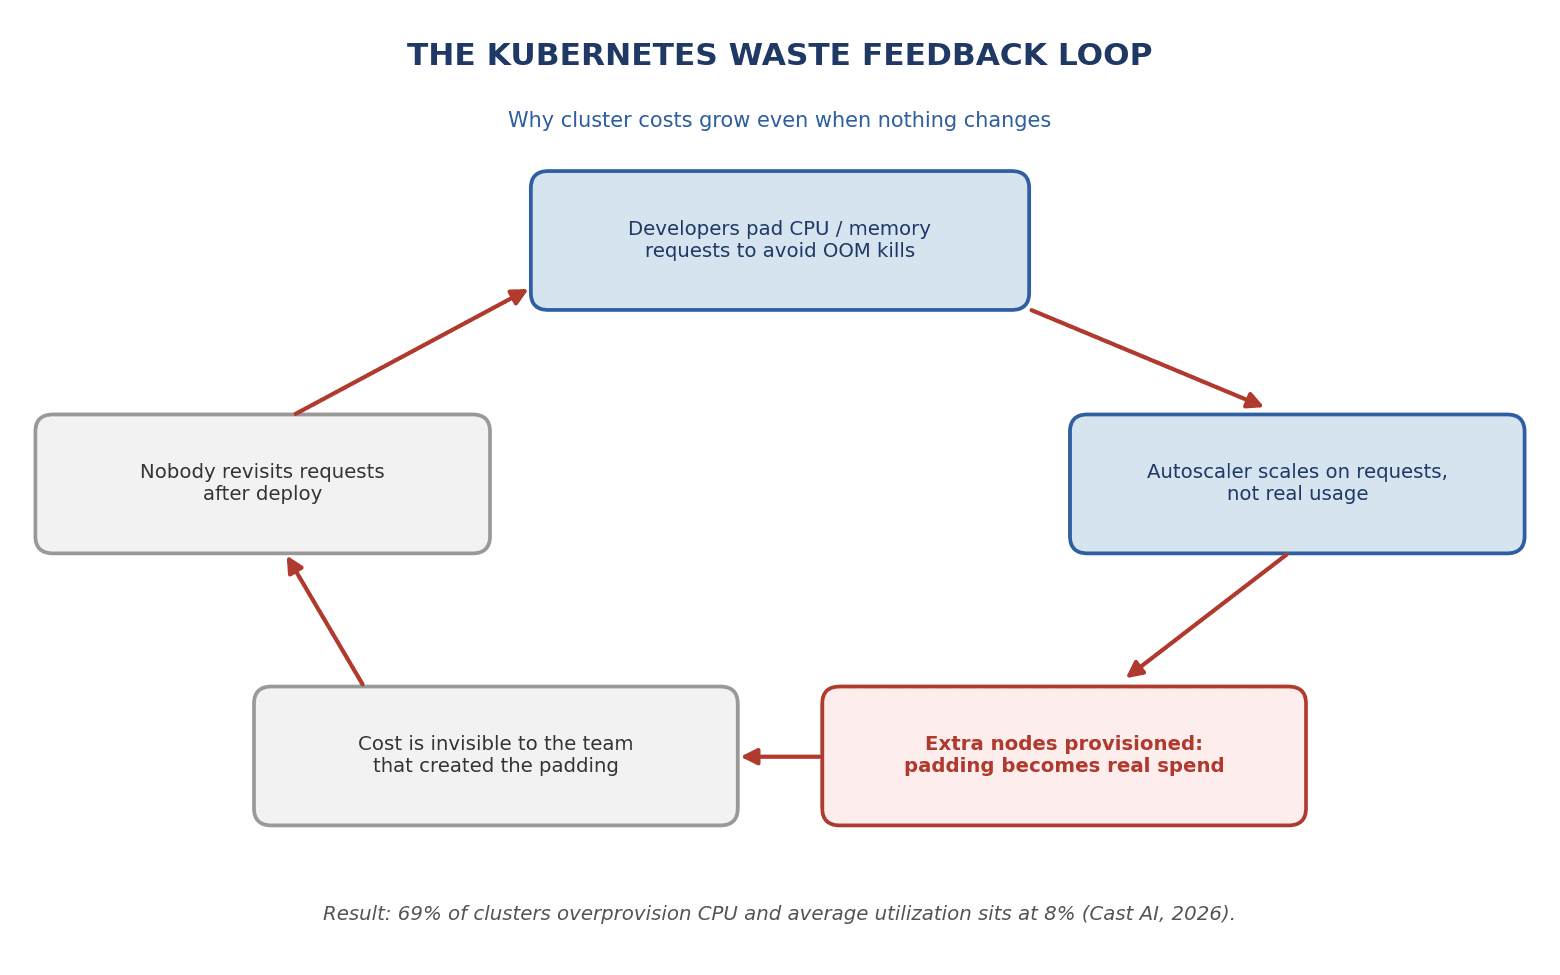
Costs grow because Kubernetes optimization is rarely practiced as a discipline. Resource padding becomes permanent, and autoscalers happily scale that waste into real infrastructure cost.
The feedback loop works like this: developers set inflated CPU and memory requests to avoid OOM kills and throttling. Helm charts ship conservative defaults that nobody revisits after the initial deploy. Cluster Autoscaler adjusts node counts based on workload demands as expressed through resource requests, not real usage. So padded requests become real nodes, and real nodes become real spend. Overprovisioned nodes waste resources and increase cloud bills, but the teams who added the safety margins rarely see that cost impact. The padding continues release after release.
This waste accumulates across four distinct cost layers:
- Over-provisioned pods: resource requests set several times above actual usage, plus sidecar and debug containers adding idle overhead.
- Oversized or idle nodes: nodes under-populated with pods, or slow scale-down leaving spare capacity running for hours.
- Inefficient pricing: using on-demand instances where spot instances or savings plans would cut the unit price by 60 to 90 percent.
- Idle GPUs: reserved “just in case” for AI and ML workloads, with GPU utilization averaging only 5 percent across the industry.
Beyond compute, hidden line items quietly inflate Kubernetes spend. Orphaned persistent volumes and unused load balancers continue billing after the workloads they served are gone. Cross-AZ and cross-region data transfer charges add up when services communicate across availability zones. Managed control plane fees apply per Kubernetes cluster on EKS, GKE, and AKS. These costs rarely appear in APM dashboards, so they persist unnoticed.
Kubernetes optimization, as a discipline, exists to break this feedback loop: measure real resource usage, align resource allocation to demand, and govern the process so it stays aligned over time.
Kubernetes Cost Management vs Kubernetes Cost Optimization
Kubernetes cost management shows you the waste; Kubernetes cost optimization removes it.
Kubernetes cost management is the discipline of seeing and governing cloud spend. It covers cost visibility, cost allocation by namespace and team, showback and chargeback reports, budget controls, and cost alerts on spending trends. Kubernetes cost management enhances financial visibility across teams, so engineering and finance can speak the same language about where money goes. Implementing FinOps practices creates accountability in cloud spending and connects infrastructure cost to business units and business outcomes.
Kubernetes cost optimization is the set of concrete actions that use that visibility to change something: rightsizing resource requests and limits, tuning autoscaling, bin packing workloads onto fewer nodes, switching to spot instances or commitments, and cleaning up zombie resources. Effective cost management is a prerequisite for optimization, not a substitute. A dashboard alone does not reclaim a single idle core. But action without cost data can cut the wrong services or degrade reliability.
Most organizations lack strong cost ownership. Only a small minority run full chargeback, so no team has a direct incentive to optimize costs. Without ownership, runaway costs continue unchecked. If you want to align engineering and finance around shared cost objectives, FinOps consulting services can bridge that gap. The most mature teams run both disciplines: visibility first, then action.
The 2026 Numbers: How Much Clusters Actually Waste
Recent reports confirm that waste is the default state of many Kubernetes clusters, not an edge case.
The 2026 Waste Snapshot
- Average CPU utilization: 8 percent, down from 10 percent the prior year (Cast AI 2026 State of Kubernetes Optimization Report, tens of thousands of production clusters on AWS, Azure, and GCP)
- Average memory utilization: 20 percent. Average GPU utilization: 5 percent (same report)
- CPU overprovisioning: 69 percent of clusters, up from roughly 40 percent. Memory overprovisioning: 79 percent (same report)
- 83 percent of container spend is associated with idle resources (Datadog State of Cloud Costs research)
- Fewer than 2 percent of GPUs ran on spot instances in 2025; AWS raised H200 GPU prices by 15 percent in January 2026, breaking a two-decade trend of falling compute prices
At 8 percent average CPU utilization, most Kubernetes clusters pay for capacity that never does any work. These figures indicate systematic padding of resource requests far beyond what workloads actually consume. Full methodology and provider-level breakdowns are available in the Cast AI report and Datadog’s State of Cloud Costs research.
Waste is the default state of an unmanaged Kubernetes cluster, and current industry data shows that it is getting worse, not better.
Kubernetes Cost Reduction Roadmap: Six Steps in the Right Order
Kubernetes cost reduction works best as a sequence, not a grab bag of tactics. The order matters because scaling and automation applied before rightsizing will scale your waste instead of your savings. Each step builds on the one before it, and skipping ahead usually reduces impact while increasing risk.
Step 1: Get Visibility and Allocation
You cannot optimize what you cannot see. Cost allocation is the foundation of any Kubernetes cost optimization effort.
Deploy OpenCost or Kubecost early to map cloud spend down to namespaces, workloads, and labels. OpenCost is a CNCF project for real time visibility and cost allocation, well suited for teams starting with open source foundations. Kubecost provides detailed insights into Kubernetes spending with richer chargeback and governance layers built on top.
Standardize labels on namespaces, deployments, and services so spend can be attributed to teams, products, and environments reliably. Mandatory tagging policies keep untracked workloads from hiding in shared infrastructure, and ResourceQuotas prevent any single team from monopolizing cluster resources.
Start with showback reports by team before any chargeback, so engineering teams can see their Kubernetes costs without immediate budget penalties. Tying cost views into existing workflows around FinOps cloud cost optimization best practices helps finance and engineering speak the same language.
Step 2: Rightsize Resource Requests and Limits
Most cost savings come from shrinking inflated resource requests and limits back toward real resource usage, without breaking workloads.
Resource requests tell the Kubernetes scheduler how much CPU and memory to reserve when placing a pod. Limits set runtime ceilings: CPU limits cause throttling, memory limits cause OOM kills if exceeded. The official Kubernetes resource management documentation explains this distinction in detail. LimitRanges set default and maximum values for resource requests, which helps prevent extreme overprovisioning at the namespace level.
The practical method: compare current resource requests to metrics from tools like Prometheus and Grafana, which provide real time insights into actual usage. Target around p95 CPU utilization and memory utilization plus sensible headroom. In AppRecode client audits, requests are often several times higher than actual peak usage, so rightsizing alone can recover significant compute resources and deliver substantial Kubernetes cost reduction.
Test all changes progressively. Use staging and load tests, and watch for OOM kills or throttling before rolling changes across all Kubernetes clusters. Aggressive cuts without testing erode trust and stall optimization efforts.
Step 3: Tune Autoscaling for Pods and Nodes
Autoscaling should respond to real demand, not to padded requests, so rightsizing must come before aggressive autoscaling.
Kubernetes offers Horizontal Pod Autoscaler (HPA) for scaling pods. HPA adjusts pod count based on resource usage, but effective autoscaling requires well-defined signals beyond just CPU: application latency, queue depth, or custom business metrics. Setting realistic scale-up and scale-down thresholds prevents resource thrashing.
Vertical Pod Autoscaler (VPA) fine-tunes pod CPU and memory settings. Use VPA in recommendation mode first, then optionally enable automatic mode for non-critical workloads once you build trust.
For node-level scaling, Karpenter or a tuned Cluster Autoscaler handles bin packing, node consolidation, and removal of empty nodes. Lower scale-down delays so idle nodes are deprovisioned promptly. Kubernetes optimization at the node layer depends on these settings being tuned to your actual traffic patterns.
Set Pod Disruption Budgets for every workload that needs availability guarantees. Graceful eviction policies ensure that cost-saving scale-down actions do not violate availability objectives or disrupt stateful services.
Step 4: Fix Your Purchasing Mix
Once resource utilization is under control, you can safely commit to smarter cloud purchase options and reduce the unit price of your Kubernetes resources.
Classify workloads into three categories based on metrics history:
- Steady baseline: predictable, always-on services that benefit from reserved instances or savings plans.
- Variable but predictable: workloads with known patterns (daily spikes, weekly batch jobs) that can be matched to scheduled capacity.
- Bursty or experimental: unpredictable workloads where on-demand pricing is the safest choice.
Spot instances provide significant savings for non-critical workloads, typically 60 to 90 percent cheaper than on-demand pricing. Run stateless, fault-tolerant Kubernetes workloads on spot with clear fallback mechanisms for interruptions. For steady baseline capacity, use reserved instances or savings plans following AWS EKS Cost Optimization Best Practices and similar guidance from Azure and GCP. On-demand instances remain appropriate for unpredictable or very short-lived workloads where commitments would not pay back.
The key is matching each workload category to the right pricing tier, not committing everything to one strategy.
Step 5: Clean Up Hidden and Zombie Costs
Many Kubernetes costs hide in resources nobody is watching, from orphaned persistent storage to stale networking artifacts.
Specific cleanup targets include:
- Unused namespaces and zombie deployments that consume cluster resources
- Orphaned persistent volumes still billing for storage after their pods are gone
- Idle load balancers and old ingress definitions that incur fees monthly
- Stale ConfigMaps and Secrets that add clutter and slow operations
Automated cleanup and monitoring identify orphaned resources faster than manual effort alone, and automated shutdown of idle clusters cuts unnecessary consumption, especially in development and staging environments.
Review cross-AZ and cross-region traffic patterns to optimize data transfer charges. Consolidate services where appropriate and be conscious of egress to external APIs or data lakes. Align storage classes with performance needs: downgrade non-critical data from SSD tiers and review retention policies.
This cleanup should be institutionalized as a regular practice, not left as occasional hero work by a single platform engineer.
Step 6: Make Cost Optimization Continuous
Without a continuous process, Kubernetes costs drift back upward as new services, teams, and defaults appear over time.
Add a lightweight cost review to sprint rituals or platform review meetings, focused on the top waste contributors rather than every line item. Regular audits validate resource usage against expectations, and clear baselines help teams react to unexpected consumption before it becomes permanent.
Set cost alerts on utilization ratios (CPU utilization versus requests) and on spend anomalies per namespace or environment. Connect this step with safe automation: introduce tools and policies that enforce good defaults, and keep platform engineers in the loop for critical workloads where manual review provides better risk management.
For organizations where internal bandwidth is limited, ongoing partnership through managed cloud services can keep Kubernetes cost optimization on track as the platform and teams grow.
Automated Kubernetes Cost Optimization: What to Automate and What to Keep Manual
Automated Kubernetes cost optimization is essential for keeping up with changing workloads, but it is not safe to apply everywhere on day one. Rightsizing done once at deploy time is not really rightsizing, because workloads change, traffic shifts, and configurations drift.
Modern automation platforms can do several things well: continuous rightsizing of resource requests based on observed usage, automated bin packing and node consolidation, spot instance orchestration across Kubernetes workloads, and dynamic provisioning that adapts resources to actual demand. These capabilities work at a speed that manual effort cannot match, and they are the only approach that keeps pace with environments where dozens of deployments change every week.
The risks are real, and vendors tend to gloss over them. Aggressive auto-rightsizing can squeeze memory limits until OOM kills occur. Misconfigured automation may ignore Pod Disruption Budgets, causing stateful workloads to restart unexpectedly. Frequent rescheduling of pods can destabilize databases, message brokers, and other stateful services. CPU limits set too close to actual usage produce silent throttling that degrades application performance without triggering obvious alerts.
Safe Rollout Checklist for K8s Cost Optimization Automation
- Start in recommendation-only mode. Review suggestions for two to four weeks before enforcing changes.
- Restrict enforcement to stateless services first: HTTP APIs, cron jobs, workers with good retry behavior.
- Keep manual control for databases, message brokers, and other stateful Kubernetes workloads until you have strong tests and clear Pod Disruption Budgets in place.
- Expand automated Kubernetes cost optimization only after observing several weeks of stable behavior and validating that SLOs and error budgets remain healthy.
In one case documented in Cast AI’s telemetry, automated rightsizing cut provisioned CPU by approximately 50 percent while OOM kills dropped from 40 to 50 per interval to near zero, with reliability improving rather than degrading.
Kubernetes Cost Optimization and Management Tools
Tools that provide Kubernetes cost management visibility and tools that automate Kubernetes cost optimization solve related but distinct problems. No single tool covers every k8s cost optimization need for all organizations. A mature stack usually includes at least one allocation and reporting tool, and optionally one automation tool if the organization accepts its trade-offs.
Open source tools cost less money but require operational investment. SaaS automation platforms save compute costs but carry platform fees that must be smaller than the savings they deliver. Real time visibility is the baseline; automated remediation is the next layer for teams ready to accept some tool dependency.
Below is a comparison of the most relevant tools across visibility and automation categories. Use it as a starting point for evaluating what fits your Kubernetes environments.
| Tool | Category | Best For |
|---|---|---|
| OpenCost | Open-source, CNCF cost allocation and visibility | Teams starting FinOps with open-source cost allocation across clouds |
| Kubecost | Visibility, Kubernetes cost management, and chargeback | Organizations needing cost reports, showback, and governance built on OpenCost |
| Cast AI | Autonomous optimization platform | Autonomous bin packing, rightsizing, and spot automation |
| ScaleOps | Automated rightsizing and remediation | Real-time CPU and memory optimization for production clusters |
| StormForge | ML-based rightsizing recommendations | Data-driven resource configurations without full automation |
| Karpenter | Open-source node provisioning and consolidation | AWS-native clusters needing fast, flexible node lifecycle control |
| Goldilocks | Open-source VPA-based request recommendations | Conservative environments wanting safe, no-enforcement rightsizing suggestions |
| AWS Cost Explorer, Azure Cost Management, GCP Recommender | Cloud-native billing visibility | High-level cloud spend insights from infrastructure providers |
Key advice: visibility tools and optimization tools solve different problems. Use a Kubernetes cost management tool for cost attribution and governance. Layer in automation once your resource requests reflect reality, not the inflated defaults from six months ago. AWS Cost Explorer with split cost allocation data provides useful top-level insights, but lacks the granularity of dedicated Kubernetes cost monitoring at the pod level.
Common Kubernetes Cost Optimization Mistakes
Most Kubernetes cost optimization failures come from doing the right things in the wrong order or with incomplete cost data.
Automating on top of padded requests. Enabling autoscaling when resource requests are grossly inflated simply automates and multiplies existing waste. The autoscaler scales to meet requested capacity, not real usage, so you get more nodes running the same idle resources. Kubernetes optimization requires accurate baselines before automation.
Treating optimization as a one-time project. A single audit produces short-term gains, but costs creep back as new workloads arrive with default or copy-pasted resource configurations. Without ongoing controls, efficiency improvements decay within months.
Slashing requests without load testing. Aggressively cutting resource requests without observing p95 or p99 usage leads to OOM kills, throttling, and incident fatigue. Engineers lose trust in cost initiatives when reliability suffers, and recovering that trust takes far longer than the savings were worth.
Ignoring non-compute costs. Teams that focus only on compute while storage, egress, and observability tools quietly scale with every new Kubernetes cluster and namespace miss a large portion of unnecessary costs.
Chargeback before showback. Implementing chargeback before teams have had time to understand their cost attribution through showback feels punitive. It damages collaboration between engineering and finance and turns FinOps into a blame exercise.
Ignoring GPU workloads. Writing off GPU spend because “the AI team owns them” is increasingly risky. GPU utilization averages 5 percent, but absolute GPU spend is large and growing, especially after recent price increases from cloud providers.
How AppRecode Approaches Kubernetes Cost Optimization
We treat Kubernetes cost optimization as a structured engagement, not a quick spreadsheet exercise.
Our process starts with a baseline audit: CPU utilization, memory utilization, GPU utilization, and resource allocation by namespace, team, and environment. We quantify the gap between resource requests and real usage, then prioritize the largest offenders so early work delivers visible Kubernetes cost reduction. This ensures that optimization efforts target where the money actually goes, not where assumptions say it goes.
From there, we fix labeling and cost allocation gaps so every namespace has clear ownership. We implement rightsizing in a controlled rollout, starting with the noisiest workloads and expanding gradually. We tune autoscalers and node provisioning to match real demand, and we help clients adjust their instance mix and savings strategies across AWS, Azure, and GCP, aligning commitments with right-sized clusters rather than with over-provisioned baselines.
We also balance cost against reliability. We use staging validation, Pod Disruption Budgets, and error rate monitoring to ensure that cost changes do not degrade the services that matter most.
Proof Point from Our Practice
- For one client, we rebuilt a delivery platform with improved observability and automation, cutting deployment time by 40 percent and incidents by 32 percent. That reduced both infrastructure waste and the engineering hours spent firefighting.
If your organization needs deeper help, our Kubernetes consulting services team can run a dedicated audit and build a prioritized reduction roadmap tailored to your Kubernetes infrastructure.
FAQ
What is Kubernetes cost optimization?
For me, Kubernetes cost optimization starts with one question: what are we paying for that the product does not need? Sometimes the answer is a pod asking for too much CPU. Sometimes it is a node group that never scales down. Sometimes it is an old volume, a load balancer, or a logging bill nobody checks.
This is why I would not call it only a finance exercise. Finance can show the bill, but engineers have to understand the workload. A request that looks wasteful may be protecting a service from a monthly traffic spike. A cheap node may be a bad choice for a latency-sensitive API.
The useful work is practical: assign owners, compare requests with real usage, rightsize carefully, tune autoscaling, clean up leftovers, and choose better pricing where it fits. The goal is not the smallest cluster on paper. The goal is less waste with production still boring after the change.
What is the difference between Kubernetes cost management and cost optimization?
Kubernetes cost management tells you where the money goes. Kubernetes cost optimization changes the system so less money is wasted. Those sound close, but the day-to-day work is different.
Cost management is about visibility and accountability. It usually includes allocation by namespace, team, service, environment, label, or product. It also covers budgets, alerts, showback, chargeback, and reports that finance and engineering can both understand. Tools like OpenCost or Kubecost are useful here because cloud bills alone rarely explain pod-level spend clearly.
Cost optimization is the next step. It asks what should change. Maybe one service requests four CPUs and uses 300 millicores. Maybe staging runs all night for no reason. Maybe an old persistent volume is still attached to nothing. Maybe a node group is sized for traffic that only happens twice a month.
I would not skip the management part. Without it, teams cut blindly and may break the wrong workload. But I also would not stop at dashboards. A dashboard does not save money by itself. It only shows where the work should begin.
How much money is typically wasted in a Kubernetes cluster?
I would be careful with any single waste percentage. Public reports are useful, but they are not a blood test for your cluster. Cast AI’s 2026 report found very low average CPU use in the clusters it studied, and Datadog has reported that a large share of container spend is tied to idle resources. Those are strong warning signs.
Still, your own waste may be lower, higher, or simply located somewhere else. A young startup with two services has a different profile from a bank running many namespaces, test clusters, and stateful workloads.
In audits, the money usually hides in familiar places: inflated CPU and memory requests, nodes that stay mostly empty, dev environments running all weekend, orphaned disks, old load balancers, chatty cross-zone traffic, and GPUs booked “just in case.”
So the honest answer is: measure it. Start with requested versus used resources, idle node capacity, storage without owners, and spend by namespace.
Is automated Kubernetes cost optimization safe for production workloads?
Automated Kubernetes cost optimization is safe only when it behaves like any other production change. I would not switch it on across the whole platform and hope the tool is clever. Start with recommendations, read them, and compare them with the metrics your team already trusts.
The first enforcement targets should be boring workloads: stateless APIs, workers with retries, scheduled jobs, internal tools, and non-production environments. If something breaks, rollback should be simple and nobody should lose data.
Be much slower with databases, queues, brokers, and customer-critical paths. A tool may see unused memory and suggest a smaller limit, but it may not understand the monthly batch job that needs that memory for twenty minutes.
The risky parts are OOM kills, CPU throttling, too much pod movement, and spot interruptions without a fallback. Automation can save real money. It just needs SLOs, Pod Disruption Budgets, owners, exclusions, and a staged rollout.
What are the best k8s cost optimization tools in 2026?
I would split the tool choice into two buckets. First, you need to see the cost. OpenCost is a good open-source base for Kubernetes cost allocation, and Kubecost is stronger when a team wants reporting, showback, chargeback, and governance around that data.
Second, you may want a tool that changes things. Cast AI, ScaleOps, and other optimization platforms can recommend or automate rightsizing, node consolidation, and cheaper capacity. I would test them in recommendation mode before allowing enforcement in production.
Karpenter belongs in the conversation too, especially for AWS-heavy teams. It helps provision and remove nodes based on workload needs, so it can reduce waste when requests and disruption rules are sane.
Do not forget the cloud bill itself. AWS Cost Explorer, Azure Cost Management, and Google Cloud billing tools still matter for commitments, data transfer, storage, and account-level spend. My default stack is simple: one Kubernetes allocation tool, one cloud billing view, and automation only after labels and ownership are clean.
How do spot instances reduce Kubernetes costs?
Spot instances reduce costs because you use spare cloud capacity instead of paying the full on-demand price. The discount can be large, often enough to change the economics of batch jobs, workers, test environments, and stateless services. But cheap compute is only useful when the workload can survive interruption.
The right candidates are jobs that can retry, services that run multiple replicas, queue workers, CI workloads, analytics jobs, and non-critical environments. The wrong candidates are usually single-replica databases, brittle stateful services, and anything where sudden termination would cause customer-visible damage or data loss.
In Kubernetes, spot strategy is not just “add spot nodes.” You need node pools or provisioners, labels, taints, tolerations, topology choices, graceful termination handling, and enough fallback capacity. Pod Disruption Budgets and sensible replica counts matter because the platform needs room to move workloads safely.
I would also avoid putting every eligible workload on spot at once. Start with a clear interruption plan and a small workload group. Watch eviction behavior, queue delay, error rate, and cost. If the service handles interruptions quietly, expand. If not, the cheaper node was not really cheaper.
Where should a team start with Kubernetes cost reduction?
Start with visibility, not with cuts. It is tempting to open the biggest namespace and reduce every request by half, but that is how cost projects become incident projects. First, make sure every namespace, deployment, and expensive workload has an owner. If nobody owns it, nobody will defend or fix it.
Next, compare requested resources with real usage. CPU and memory requests drive scheduling, and inflated requests often turn into real node spend. Look at p95 or p99 usage over a meaningful window, not only a quiet afternoon. Separate steady services from bursty jobs and memory-sensitive workloads.
Then clean up the obvious waste. Unused namespaces, old test environments, orphaned persistent volumes, forgotten load balancers, oversized storage classes, and stale node pools often produce savings without touching application code.
After that, tune autoscaling. HPA, VPA recommendations, Cluster Autoscaler, and Karpenter can help, but they work better once requests are realistic. Finally, review purchasing options: savings plans, reserved capacity, spot nodes, and scheduled capacity for predictable workloads.
The order matters. Visibility, ownership, rightsizing, cleanup, autoscaling, then purchasing. If you buy commitments before fixing waste, you may lock in yesterday’s mistakes.
Which metrics matter most before rightsizing Kubernetes workloads?
Before rightsizing, I want a few boring numbers and a few product signals. CPU and memory averages are not enough. They hide spikes, batch windows, release days, and the one customer report that runs every Monday morning.
Start with p95 and p99 CPU and memory usage, then compare them with current requests and limits. Check CPU throttling, OOM kills, restarts, pending pods, replica changes, and node pressure. If memory jumps suddenly, do not cut it aggressively just because the weekly average looks low.
Then look at the application itself. Latency, error rate, queue depth, job duration, database connections, and key business actions tell you whether the service is healthy after a resource change.
History matters. Use enough data to include busy and quiet periods. For a new workload, begin with a safer request and revisit it soon. Rightsizing is best when metrics and service-owner context meet in the same conversation.
How can teams reduce Kubernetes costs without hurting reliability?
The safest way is to treat cost changes like reliability changes. Make them small, observable, reversible, and owned. Do not turn a cost review into a surprise production experiment.
Begin with low-risk savings. Delete unused resources, shut down idle non-production clusters on a schedule, remove orphaned volumes, retire old load balancers, and fix labels so waste has an owner. These changes usually do not touch request limits or customer traffic.
When you do change workload resources, move gradually. Pick one service, compare requests with real usage, set a sensible new target, deploy it, and watch the service under normal and busy conditions. Look for OOM kills, CPU throttling, latency, error rate, and queue delay. If the signals stay clean, repeat with the next group.
Autoscaling and spot capacity should also roll out in layers. Start with stateless workloads and clear rollback. Keep stateful workloads, databases, and queues under stricter review.
Reliability is part of the savings calculation. If a change saves $2,000 but causes an incident, it may be a bad trade. Good optimization removes waste while keeping SLOs boring.
How often should Kubernetes cost optimization be reviewed?
I would review Kubernetes costs continuously at the tooling level and deliberately at the team level. The tooling should watch every day for spend anomalies, idle resources, request-to-usage gaps, and sudden changes by namespace or workload. Humans do not need to stare at dashboards all day, but the alerts should catch drift early.
For team review, monthly is a reasonable starting rhythm for most companies. Look at the top cost movers, biggest idle resources, most over-requested workloads, and any new clusters or node pools. Keep it focused. If the meeting becomes a line-by-line cloud bill reading, engineers will tune out fast.
For fast-moving platforms, add a lightweight check during sprint planning or platform reviews. New services should ship with labels, owners, requests, limits where appropriate, and basic scaling assumptions. Otherwise every new deployment becomes future cleanup work.
Bigger reviews should happen after architecture changes, cloud migrations, major traffic shifts, AI/ML workload launches, and contract renewals. Those moments change the economics.
Cost optimization is not a one-time cleanup. Kubernetes drifts because teams deploy, traffic changes, defaults get copied, and old resources linger. The review process is what keeps yesterday’s good tuning from becoming next quarter’s waste.
Conclusion and Next Steps
Kubernetes cost optimization is about aligning resource allocation and pricing with real demand, without sacrificing reliability. The sequence matters: start with cost visibility and Kubernetes cost management, then rightsize, tune autoscaling, fix your purchasing mix, clean up hidden waste, and build the continuous process that prevents costs from drifting back. Only then does full automation make sense.
The biggest gains usually come from addressing idle resources and overprovisioned workloads that nobody owns yet. In most Kubernetes clusters, simply matching requests to actual usage lowers costs significantly before you touch a single purchasing decision.
AppRecode’s Kubernetes and FinOps consultants audit your cluster utilization, quantify the waste, and deliver a prioritized Kubernetes cost reduction roadmap tailored to your environment. If you want ongoing support to control costs as your platform grows, our managed cloud services keep optimization efforts on track long after the initial engagement.