
Key Takeaways
- Monitoring tells you when something is wrong using predefined metrics and thresholds. Observability explains why by letting you explore logs, metrics, and traces, including failures you never predicted.
- The core difference between monitoring and observability is scope: monitoring catches known failure modes, while observability enables investigation of unknown unknowns across complex distributed systems.
- Monitoring alone is enough for simple, stable systems. Distributed microservices on Kubernetes or AI workloads almost always require both observability and monitoring to maintain system reliability.
- Monitoring is a subset of observability. Combining monitoring alerts with observability workflows reduces MTTR and prevents recurring incidents.
- AppRecode writes from hands-on DevOps consulting experience, not as a tool vendor. This article includes a real incident example, a comparison table, and an honest tools overview.
Introduction: A Practitioner's Answer to Observability vs Monitoring
Monitoring tells you when something is wrong by firing alerts when predefined thresholds are crossed. Observability tells you why a system is failing by letting you explore correlated telemetry data, including failures you never anticipated. That is the difference between monitoring and observability in one breath: one detects, the other explains. Understanding observability vs monitoring starts with this distinction.
Both monitoring and observability are necessary for modern IT operations. They are complementary, not competing. Monitoring is a subset of observability, and both use logs, metrics, and traces, but in fundamentally different ways. Observability and monitoring together enhance system reliability and performance far beyond what either achieves alone.
In this article, you will get clear definitions, a single incident walked through twice as a monitoring vs observability example, a side-by-side comparison table, coverage of observability and monitoring tools, and an honest decision framework. As a DevOps consultancy that has implemented plain monitoring stacks and full observability platforms for real clients, AppRecode wrote this article from production experience, not vendor marketing.
What Is Monitoring?
Definition. Monitoring is the systematic collection of predefined metrics against known thresholds, with alerting when those thresholds are crossed. It answers one question: “Is the system working right now?”
By design, monitoring is primarily reactive, focusing on known issues that you anticipated and encoded as rules.
Monitoring tools track metrics like CPU usage, memory usage trends, request latency, HTTP error rates, disk space, and uptime. Typical thresholds look like CPU utilization above 90 percent, response time above 500 ms, or error rate above 1 percent. When a threshold is breached, monitoring alerts users through PagerDuty, Slack, or email. In essence, monitoring provides alerts for known issues in real time, giving teams immediate insight into system health. As the Google SRE Book describes it, monitoring is the collection, processing, and display of real-time quantitative data: error counts, request durations, and processing times.
The concept behind this is “known unknowns.” You know a failure could happen, such as a disk filling up, so you set a threshold and wait for the alert. Monitoring tools focus on known issues and predefined thresholds, and they work well for predictable failure modes. Classic monitoring often includes basic application performance monitoring, infrastructure dashboards, network performance checks, and synthetic uptime tests. For many teams, especially those running a single-node Rails monolith with Prometheus and Grafana, this is an appropriate and sufficient starting point. It covers the operational surface without requiring deep instrumentation or high telemetry costs.
What Is Observability?
Definition. Observability, rooted in control theory, is the ability to infer a system’s internal state from its external outputs. In software engineering, it answers a harder question: “Why is the system broken, and how do we prove it?”
Where monitoring flags symptoms, observability analyzes monitoring data to uncover root causes. Observability enables proactive identification of potential issues, not just reaction to known ones. For a deeper look at how this plays out in practice, see our guide on observability in DevOps.
The three pillars of observability are metrics, logs, and traces. Metrics are quantitative data measurements of system performance, numeric time-series values like request latency or error rates, often enriched with high-cardinality labels such as user_id or endpoint. Logs contain information about system operations and activities, capturing discrete events with rich context like stack traces and error messages. Traces show the full path of a single operation across systems, exposing where latency or failure occurs as a request moves through multiple services. Modern definitions extend to MELT (metrics, events, logs, traces) and sometimes include profiling and real user data collection, all relevant in distributed systems and microservices architectures.
Observability enables investigation of unknown unknowns. It lets engineers ask ad hoc questions about new failure modes without redeploying code or building new dashboards first. This is vital in dynamic Kubernetes and serverless environments where interactions between system components are combinatorial and unpredictable. Observability uses metrics, logs, and traces for deeper analysis, giving teams the ability to gain insights into behavior they did not anticipate.
Observability lets you ask new questions about your system without shipping new code.
The instrumentation standard making this practical at scale is OpenTelemetry. It provides vendor-neutral APIs, SDKs, and a Collector for collecting data across 12+ languages and exporting telemetry to any backend. In May 2026, the CNCF officially graduated OpenTelemetry, recognizing it as production-ready and the de facto observability standard. It is now the second-largest CNCF project after Kubernetes, with over 12,000 contributors from 2,800+ companies.
Monitoring vs Observability: The Core Difference
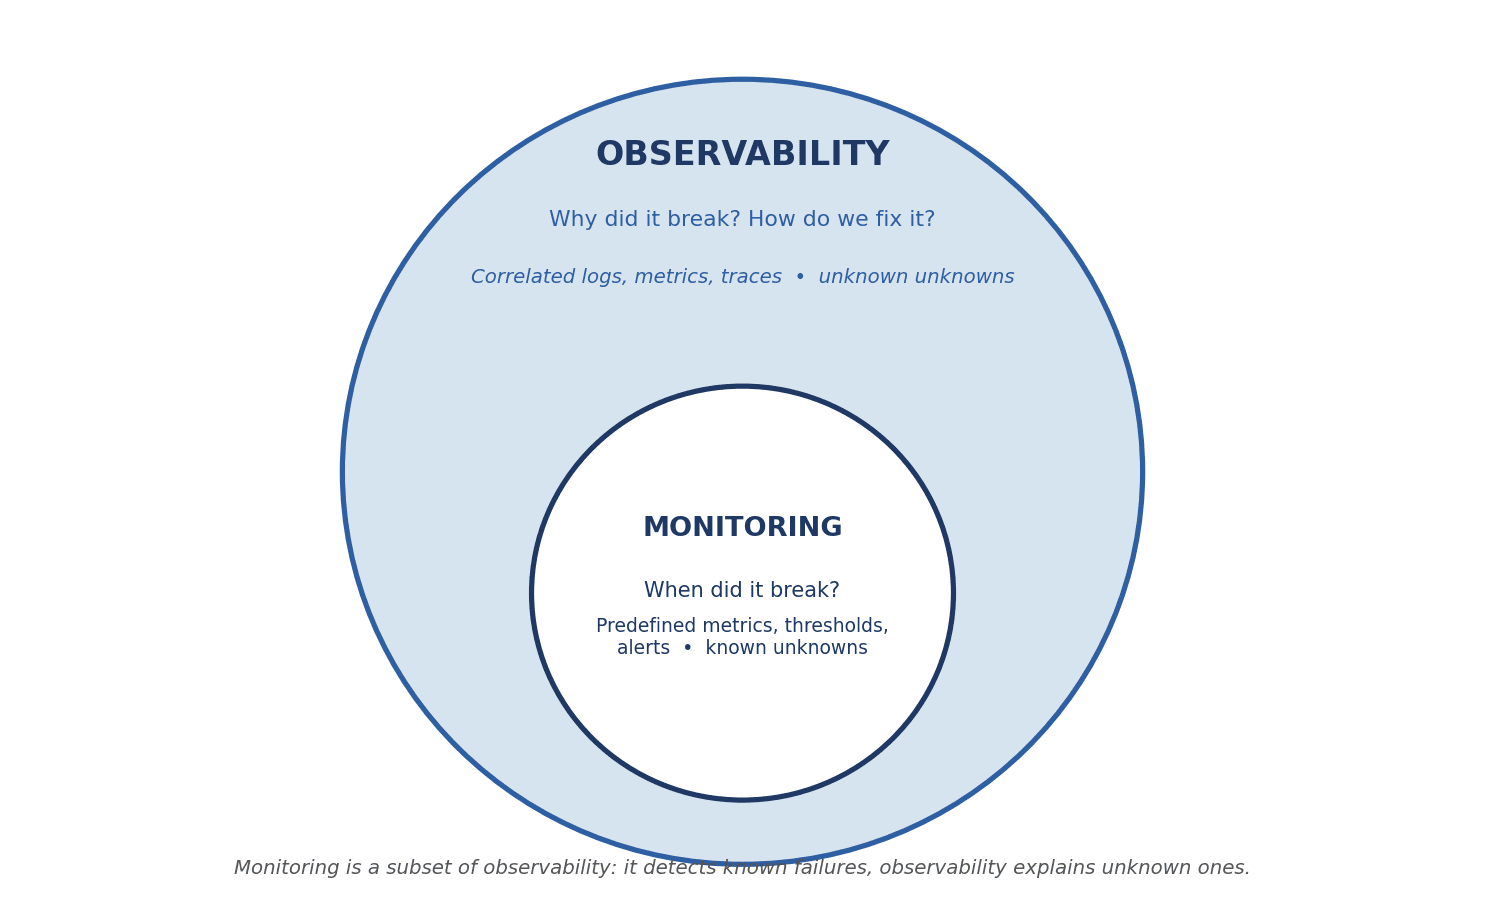
The difference between observability and monitoring comes down to this: monitoring is a subset of observability, and you cannot have an observable system without basic monitoring data feeding it. Together, they enhance system reliability and performance in ways neither can alone.
Monitoring answers “what and when” through dashboards, specific metrics, and threshold-based alerts. Observability answers “why and how” by correlating logs, metrics, and traces across services and infrastructure. Monitoring tracks known issues while observability reveals unknowns. Observability analyzes data to understand why issues occur and allows for exploratory data analysis and investigation across individual components you might never have suspected. Monitoring is reactive, while observability is proactive.
The following table summarizes the key differences between monitoring and observability across several dimensions:
| Dimension | Monitoring | Observability |
|---|---|---|
| Question Answered | What is broken? When did it break? | Why did it break? How do we fix it? |
| Approach | Reactive: dashboards, thresholds, alerts | Proactive and exploratory: data correlation, investigation |
| Data | Predefined metrics, aggregated data, key indicators | Correlated logs, metrics, distributed traces, high-cardinality attributes |
| Failure Modes Covered | Known, anticipated (known unknowns) | Unknown, novel, emergent (unknown unknowns) |
| Best Environment | Stable monoliths, predictable workloads, static networks | Distributed microservices, Kubernetes, dynamic systems, AI workloads |
| Typical Outcome | Alert fired, resource scaling, restart | Root cause found, permanent fix, recurrence prevented |
| Team Practice | Dashboards, threshold alerts, monitored metrics | Trace-driven debugging, SLIs/SLOs, incident reviews with contextual data |
Observability provides a holistic view of system performance by synthesizing telemetry from multiple sources. The reactive vs proactive distinction is especially visible in complex distributed systems: a threshold alert on high CPU usage tells you a pod is struggling, but only traces and correlated logs reveal the upstream service causing the load. Monitoring is best suited for predictable systems, while observability excels in distributed architectures where failure modes are combinatorial.
Monitoring detects known failures; observability explains unknown ones. It is not a choice between two competing tools. It is a question of depth.
Monitoring vs Observability Example: One Incident, Two Outcomes
This section provides a single monitoring vs observability example, walking through the same incident twice to show different outcomes in a realistic production setting.
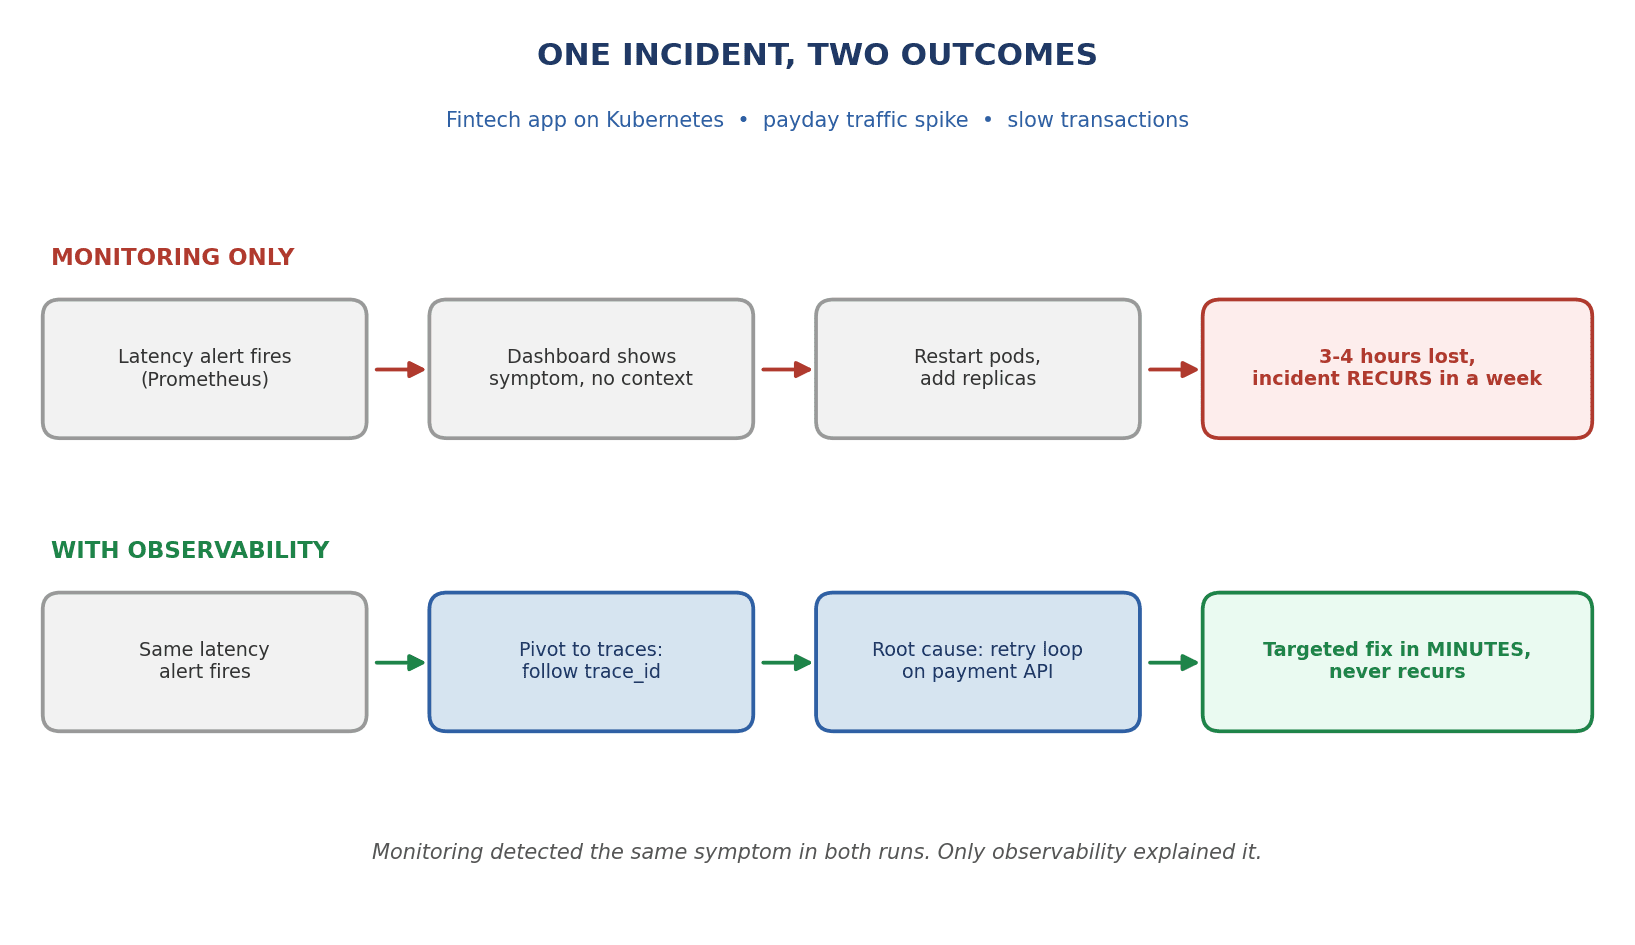
Scenario. A fintech web and mobile application runs on Kubernetes. The backend consists of eight microservices and relies on an external payment API. It is payday. Traffic spikes. Users start reporting slow or stuck transactions.
Pass 1: monitoring only. Prometheus fires a latency alert on the payment pod. The on-call SRE opens Grafana, sees red on the dashboard for request latency and elevated CPU usage, but has no request-level traces or structured log correlation. The system metrics show a symptom, not a cause. Monitoring tools provide immediate insights but lack deep context. The team restarts the payment pods, increases replicas, and watches the dashboards. Latency drops. The incident is marked “resolved.” One week later, the same pattern appears. Another restart. More hours lost. Debugging requires SSH into hosts, grepping logs across services, cross-referencing timestamps manually. Three to four hours each time, with no permanent fix because the actual root cause is invisible.
Pass 2: with observability. The same latency alert fires. But now the engineer pivots from the metric to distributed traces in the observability platform. She searches by trace_id, follows a slow transaction through the API gateway, the order service, the payment service, and into the external payment API call. Within minutes, she identifies a retry loop: the payment service retries a failing call to the external API caused by an edge-case input (a currency code the API rejects silently). Observability reduces mean time to resolution by providing deep context. She confirms the finding with correlated logs showing the exact user_id and error payload. The fix is a targeted input validation change. MTTR drops from hours to minutes. The incident does not recur.
Monitoring detected the same symptom in both runs. Observability helps identify root causes of system issues, and in this case, only observability revealed and proved the real root cause. Observability enables real-time root cause analysis in complex environments where monitoring alone leaves teams guessing.
Why the Difference Matters More in 2026
In 2026, the practical impact of observability vs monitoring is larger because systems, standards, and workloads have changed in ways that make threshold-based monitoring insufficient on its own.
Driver 1: System complexity. Distributed microservices, event-driven architectures, and heavy reliance on third-party APIs make failure modes combinatorial. A single user request might touch ten services, three databases, a message queue, and an external API. Network data, network throughput, and inter-service latency all contribute to system behavior that is nearly impossible to predict with predefined thresholds. Observability tools help identify unknown issues in distributed systems, and observability provides insights into complex and unexpected issues that simple alerting misses.
Driver 2: OpenTelemetry maturity. The CNCF graduated OpenTelemetry in May 2026, marking it as production-ready, vendor-neutral, and stable. According to the Elastic/EMA report on OpenTelemetry adoption, 48 percent of organizations are currently using OpenTelemetry, another 25 percent plan to implement it, and 25 percent are evaluating. Instrumentation is now portable: you can switch backends without re-instrumenting your code, which eliminates a major source of vendor lock-in.
Driver 3: AI and LLM workloads. According to the CNCF Annual Survey, roughly 66 percent of organizations run generative AI workloads on Kubernetes. Token counts, model drift, inference latency, and agent traces go far beyond simple threshold monitoring. These workloads require further analysis of raw data from multiple services, and traditional monitoring tools cannot capture gradual degradation in model accuracy or external API behavior.
Cost reality. According to the Grafana Observability Survey 2025, observability spend averages around 17 percent of total compute infrastructure spend, and organizations use roughly eight observability technologies on average. Uncontrolled data volume from telemetry creates real bill shock. The right balance of monitoring and observability in 2026 must include cost and team capacity, not just tool features.
Observability and Monitoring Tools
This section surveys common observability and monitoring tools by category. AppRecode stays vendor-neutral and focuses on trade-offs, because no single platform is right for every team or budget. For specialized guidance, we also offer application performance monitoring services tailored to your stack.
| Tool | Category | Best For |
|---|---|---|
| Prometheus + Grafana | Open-source metrics monitoring and visualization | De facto Kubernetes standard; strong community; low license cost |
| Datadog | Commercial all-in-one observability platform | 900+ integrations; fast setup; costs escalate at scale |
| New Relic | Usage-based commercial observability | Full MELT support; transparent pricing model |
| Dynatrace | AI-driven commercial observability | Enterprise environments; automated root cause analysis |
| Grafana LGTM (Loki, Tempo, Mimir) | Open-source full observability stack | Teams wanting open-source logs, traces, and metrics at scale |
| Amazon CloudWatch | AWS-native monitoring and observability | AWS-heavy environments; tight integration with AWS services |
| SigNoz | Open-source, OpenTelemetry-native | Teams building on OpenTelemetry who want a single pane of glass |
| OpenTelemetry | Vendor-neutral instrumentation standard | Instrumentation layer, not a backend; SDKs, Collector, and semantic conventions |
| UptimeRobot / StatusCake | External uptime monitoring | Failure independence: checks run outside your infrastructure |
Many commercial observability platforms go beyond correlation and predict issues using machine learning and predictive analytics. Observability connects and correlates multiple telemetry sources for better insights, which is the core value over standalone monitoring systems.
Choose OpenTelemetry-native instrumentation first and select your backend second: you can then switch platforms without re-instrumenting your codebase.
OpenTelemetry belongs in the instrumentation layer. It is not a backend. This strategy reduces lock-in risk.
Trade-offs matter. Open-source observability tools reduce license cost but require operational effort to run, scale, and maintain in your own data centers or cloud accounts. SaaS observability platforms provide features, integrations, and managed infrastructure, but costs grow sharply with telemetry volume, high-cardinality data, and long retention. Monitoring and observability tools should be evaluated on cost per data volume, ability to correlate logs, metrics, and traces, and support for sampling and retention policies.
Keep external uptime monitoring in a separate failure domain. If your Kubernetes cluster is down, your internal monitoring is down too. External checks from tools like UptimeRobot confirm availability from the outside when everything inside your network environment has failed.
When Monitoring Alone Is Enough
Monitoring alone is still the right choice for many teams, especially where systems are simple and budgets are tight. If you run a single monolith or a handful of services with predictable workloads, clear failure modes, and minimal compliance risk, monitoring fits that environment well. A small team without dedicated SREs or platform engineers can achieve acceptable system reliability with a combination of metrics monitoring, structured logs, a few well-tuned monitoring alerts, and perhaps external uptime checks. Monitoring tools are a natural fit for static networks with predictable workloads and well-understood key performance indicators.
In these cases, you can track system health with Prometheus dashboards, set up alerts for critical metrics like error rates and resource usage, and review historical data and performance data periodically for capacity planning. You can optimize performance through aggregated data and gain insights without a full observability platform.
Signals you have outgrown monitoring
- Frequent monitoring alerts that do not lead to clear diagnoses
- Recurring “ghost” incidents that resolve on restart but come back
- Debugging that requires SSH into hosts and manual log searches across multiple services
- Incident timelines measured in hours instead of minutes
- Microservices, queues, async workflows, and third-party dependencies that create dynamic systems where thresholds alone are not enough
Monitoring should be your foundation, but complexity, rate of change, and business criticality determine when to layer observability on top.
How to Move from Monitoring to Observability: AppRecode's Approach
We follow a staged, opinionated approach to help clients move from monitoring to observability without blowing up cost or team capacity. This is how we handle it in our DevOps services engagements.
Step 1: Audit. We inventory existing dashboards, alerts, and telemetry. We routinely find that a majority of alerts in client environments are ignored or noisy. We identify gaps, such as missing traces on key request paths, and flag alerts that fire frequently but never lead to actionable insights.
Step 2: Define SLIs and SLOs. We help teams define user-impacting service level indicators first, for example p95 latency on checkout or payment success rate, and align monitoring and observability around those instead of raw CPU or memory. Observability tools can refine monitoring alerts based on these insights, replacing noisy infrastructure thresholds with signals tied to real user impact.
Step 3: Instrument critical flows with OpenTelemetry. We prioritize a small number of business-critical request paths. We use OpenTelemetry auto-instrumentation where possible and add custom spans or attributes only where they add real value for analyzing data during incidents. Effective observability is built on the principles of deep telemetry analysis, not on instrumenting everything at once.
Step 4: Centralize and correlate. We unify logs, metrics, and traces into one observability platform, correlating data collected by trace_id and attributes so engineers can pivot from an alert to a full end-to-end view in a few clicks. Observability enables teams to gather data from across system components and perform data analysis in context.
Step 5: Control costs. We implement sampling, retention tiers, and strict cardinality controls from day one to avoid runaway observability spend. The Grafana Observability Survey 2025 consistently shows cost among the top selection criteria for observability tools.
Step 6: Build habits. We encourage teams to use traces and correlated logs during incident reviews and postmortems, shifting culture from guesswork to evidence. Over time, this builds operational efficiency and makes root cause analysis the default, not the exception.
Proof points from our practice
- Kubeshop: integrating Datadog with unified monitoring cut troubleshooting time by more than 20 percent.
- Another client: rebuilding a delivery platform on Kubernetes with improved observability reduced deployment time by 40 percent and incidents by 32 percent.
These results show the direct business impact of pairing monitoring and observability.
Common Mistakes When Combining Monitoring and Observability
Many teams buy powerful observability platforms but keep old practices, which prevents them from realizing the value of monitoring and observability together.
Mistake 1: Alerting on low-level infrastructure. Keeping monitoring alerts focused on raw CPU and memory instead of user-facing SLIs and SLOs leads to noisy pages and unclear business impact. Your alerts should reflect what users experience, not what a server process reports.
Mistake 2: Collecting everything. Gathering all telemetry data at maximum detail without a plan results in very high storage and ingest bills. Without controls on high-cardinality data and retention, you drown in noise and struggle to find useful signals. Observability costs can spiral quickly without these controls.
Mistake 3: Treating observability as a purchase. Buying a platform does not change behavior. Without updating deployment checklists, coding guidelines, and incident response workflows to include instrumentation and trace-driven debugging, you end up with expensive dashboards and the same slow investigations.
Mistake 4: No external monitoring. Running all monitoring and observability tools inside the same cluster or account that is failing means you lose visibility at the moment you need it most. Independent external monitoring confirms uptime from outside your infrastructure.
Mistake 5: Skipping developer buy-in. When developers ship new services and features with almost no logs, metrics, or traces, SREs have to reverse engineer system behavior after incidents. Observability requires instrumentation to be part of the development process, not bolted on after a production failure.
FAQ
Below are answers to common questions about observability vs monitoring that go beyond what is covered in the main sections above.
Is observability a replacement for monitoring?
No. Observability does not replace monitoring, it extends it. Monitoring detects when something breaks using thresholds and health checks. Observability then explains why by correlating logs, metrics, and traces. Monitoring is a subset of observability, and both should coexist in mature SRE and DevOps practices. The difference between observability and monitoring is depth, not replacement.
What is the difference between monitoring and observability in DevOps?
In DevOps, monitoring focuses on pipeline and runtime health indicators such as build failures, deployment success rates, and error rates. Observability allows teams to explore how code changes propagate through microservices, queues, and databases. The difference between monitoring and observability is especially visible during incident response and release validation, where traces and correlated logs accelerate root cause analysis.
What are the three pillars of observability and why do they matter?
The three pillars are logs, metrics, and traces. Logs capture discrete events with context. Metrics provide numeric measurements over time. Traces map the full path of a request across services. Together, they offer complementary views of system behavior. Effective observability platforms correlate all three. Many modern tools also treat events and profiles as additional signals.
Can small teams rely on monitoring only, or do they need observability from day one?
Small teams with simple, mostly monolithic systems can reasonably start with monitoring plus structured logging. The operational surface is smaller and the cost is lower. As soon as they adopt microservices, heavy third-party APIs, or Kubernetes, they should plan a path toward observability to avoid slow, guess-based debugging that drains engineering time.
What are the best observability and monitoring tools in 2026?
There is no single best tool. Prometheus and Grafana remain the default open-source choice for metrics. Commercial platforms such as Datadog, New Relic, and Dynatrace provide integrated observability with network data visibility and predictive analytics. OpenTelemetry has become the standard for instrumentation. When choosing monitoring and observability tools, favor OpenTelemetry support to avoid lock-in.
How does OpenTelemetry relate to monitoring and observability?
OpenTelemetry is a vendor-neutral instrumentation framework, not a backend. It provides APIs, SDKs, and a Collector to capture and export metrics, logs, and traces to any backend. By standardizing data collection, it lets you switch observability tools without re-instrumenting. Its CNCF graduation in May 2026 confirmed its production readiness for both monitoring and observability use cases.
How much does observability cost compared to monitoring?
Monitoring typically costs less because it handles lower data volume and cardinality. According to the Grafana Observability Survey 2025, observability spend averages around 17 percent of total compute infrastructure spend. Costs vary widely based on retention, telemetry volume, and tool choice. Controlling cost requires sampling, cardinality limits, and tiered retention from the start.
Conclusion: Choosing Between Observability vs Monitoring in Practice
Observability vs monitoring is not an either-or decision. Monitoring tells you when something is wrong. Observability tells you why and how to fix it. Start with solid monitoring, add observability as system complexity and incident difficulty increase, and always align both with user impact instead of infrastructure metrics alone.
The right mix of monitoring and observability tools should account for cost, team skills, and OpenTelemetry support, rather than just feature checklists or vendor claims. Every system has a different threshold for when monitoring alone stops being enough, and recognizing that moment early saves real money and engineering hours.
If you want an outside perspective, AppRecode’s DevOps health check reviews your current monitoring and observability setup and delivers a prioritized roadmap. No pitch deck, just a clear view of what to fix first.